

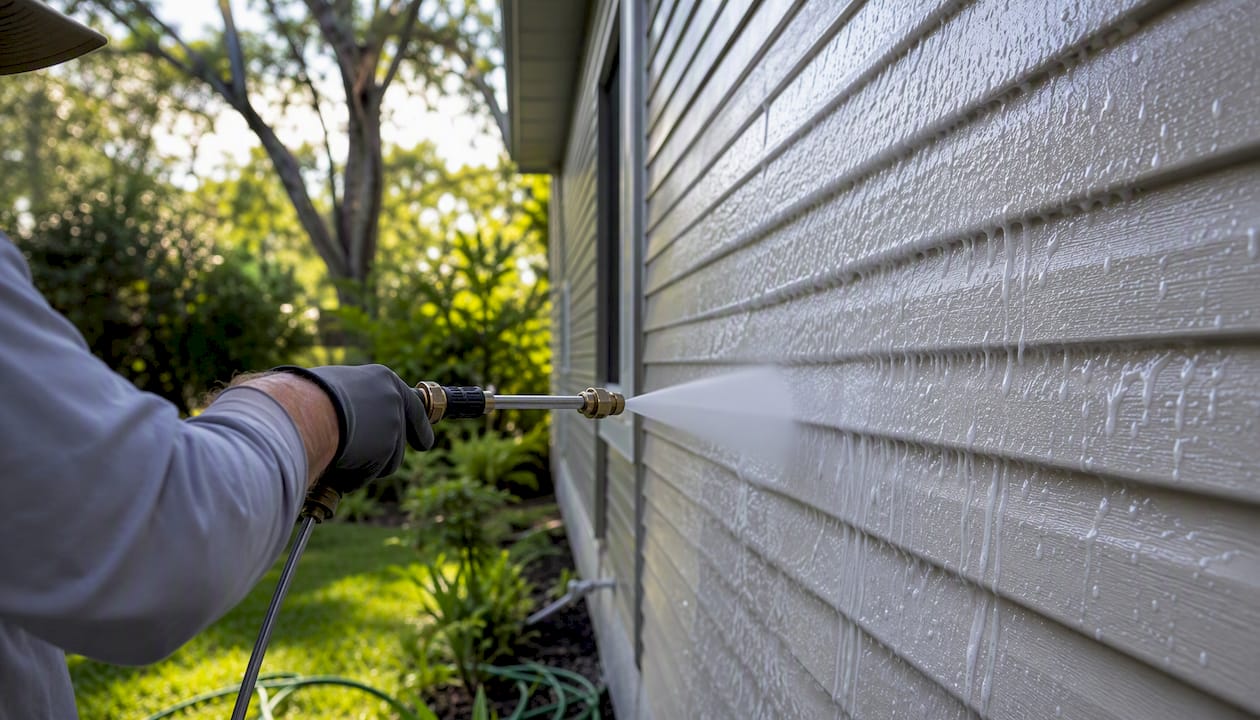
Preventive maintenance (PM) prevents most unplanned equipment failures, cuts emergency repair costs, and turns unpredictable asset spend into a forecastable line item. That is the core claim, and the evidence behind it is substantial.
Three operational impacts that matter most:
- Fewer emergency repairs. Scheduled interventions catch degradation before it becomes failure, keeping technicians on planned work instead of crisis calls.
- Longer asset life. Properly timed PM extends the mean time between failures (MTBF), reducing premature replacement cycles.
- Predictable budgeting and compliance records. A PM program creates digital audit trails that satisfy regulators and make annual budget forecasts defensible.
NIST research found that facilities relying on reactive maintenance had roughly 3.3 times more downtime than those running proactive programs, along with higher defect rates and lost-sales exposure. That gap is not a rounding error. It is the difference between a maintenance department that controls its schedule and one that is controlled by its equipment.
Key Takeaways
A well-designed PM program reduces unplanned downtime, extends asset life, and converts reactive emergency spend into predictable, budgeted maintenance cost.
| Point | Details |
|---|---|
| PM reduces downtime significantly | NIST data shows reactive-heavy facilities have roughly 3.3 times more downtime than proactive peers. |
| Use a tiered strategy | Apply predictive maintenance to critical assets, PM to moderate assets, and reactive only where failure consequence is low. |
| Measure with MTBF, MTTR, and % planned work | Track these three KPIs monthly from day one to prove program value to finance and leadership. |
| Pilot before scaling | Start with 8–20 assets, tune intervals at 90 days, then scale once compliance exceeds 85%. |
| Include exterior assets in your PM scope | Scheduled soft washing and roof cleaning protect building envelope components and reduce long-term replacement costs. |
Table of Contents
- What is the role of preventive maintenance in facility operations?
- Why preventive maintenance pays off: core benefits for facilities
- How PM fits into a tiered asset-reliability strategy
- How to design an effective preventive maintenance program
- Sample PM checklist by asset class
- Which KPIs tell you if your PM program is working?
- Common PM tradeoffs and pitfalls to avoid
- A concise PM rollout plan from pilot to full scale
- What tools and technologies support a PM program?
- Why PM is really about control, not just cost savings
- Exterior PM for your building envelope: schedule a service
- Sources
What is the role of preventive maintenance in facility operations?
Preventive maintenance is schedule-driven maintenance performed before a failure occurs, triggered by time elapsed, usage cycles, or simple condition thresholds rather than by a breakdown. The industry term is preventive maintenance (PM), though you will also see preventative maintenance used interchangeably in facility management contexts. Both refer to the same practice.
The three main PM types
Time-based (calendar) PM runs on a fixed schedule regardless of actual use: quarterly HVAC filter changes, annual boiler inspections. Simple to administer, but it can generate unnecessary work on lightly used assets.
Usage-based (cycle) PM triggers on operating hours, production cycles, or mileage. A generator serviced every 500 run-hours, or a pump inspected every 10,000 gallons pumped. More precise than calendar PM for assets with variable duty cycles.
Condition-triggered PM sets a simple threshold (vibration amplitude, temperature, pressure differential) and schedules a PM task when that threshold is crossed. It sits between pure schedule-based PM and full predictive maintenance (PdM), requiring basic sensor data but not the trend-modeling analytics that PdM demands.
How PM differs from reactive and predictive maintenance:
Reactive maintenance waits for failure. PM acts on a schedule. PdM uses continuous sensor data and statistical models to forecast the specific moment a component will fail, then intervenes just before that point. PdM demands more data infrastructure and upfront investment; PM requires only a reliable asset register and a CMMS. IBM’s maintenance taxonomy maps these distinctions clearly: each approach has different data requirements, cost profiles, and best-fit asset classes.
The practical takeaway: PM is the right default for the majority of facility assets. PdM earns its cost on your highest-criticality equipment. Reactive maintenance is only rational where failure consequence is genuinely low.
Why preventive maintenance pays off: core benefits for facilities
The IFMA Facility Management Journal frames PM as a strategic investment that shifts work from urgent events to scheduled interventions. That framing matters because it changes how finance teams see maintenance spend.
The concrete benefit buckets:
- Reduced unplanned downtime. PM catches wear before it cascades into failure, keeping production lines, HVAC systems, and building systems running on schedule.
- Lower emergency repair spend. Emergency labor rates, expedited parts, and collateral damage from sudden failures all cost significantly more than planned maintenance visits.
- Extended asset life. Peer-reviewed Weibull-based analyses confirm that properly timed PM increases machine reliability and lengthens average time between failures.
- Improved safety and compliance. Scheduled inspections catch safety hazards before they become incidents. PM records also create the documentation trail that OSHA, EPA, and local fire codes require.
- Better spare-parts planning and staffing predictability. When you know what work is coming, you can stock the right parts and schedule the right technicians without scrambling.
Statistic: NIST’s analysis of U.S. manufacturing facilities found that reactive-heavy operations had roughly 3.3 times more downtime than proactive peers, along with substantially higher defect rates.
Internally, PM benefits multiple stakeholders. Operations gets reliable uptime. Finance gets forecastable maintenance budgets. Compliance teams get audit-ready records. Tenants and building occupants get fewer disruptions. A Facilio guide notes that PM schedules reduce unexpected failures and create compliance-ready documentation, which simplifies both annual audits and insurance renewals.
Scheduled exterior maintenance fits the same logic. Routine exterior cleaning that protects roofing, facades, and hardscaping from biological growth and surface degradation is PM for your building envelope, not a cosmetic expense.
How PM fits into a tiered asset-reliability strategy
Not every asset deserves the same maintenance approach. Applying full PM to every piece of equipment in a facility wastes labor and budget. The practical framework, supported by JLL’s facility management guidance, uses three tiers:
Tier 1 (highest criticality): Predictive maintenance. Assets where failure causes safety incidents, regulatory violations, or production shutdowns. Chillers, main electrical switchgear, life-safety systems. Invest in sensors and analytics here.
Tier 2 (moderate criticality): Preventive maintenance. Assets where failure is disruptive and costly but not catastrophic. HVAC units, pumps, generators, elevators. PM schedules with defined intervals and CMMS-tracked compliance.
Tier 3 (low criticality): Reactive maintenance. Assets where failure is cheap to fix and has minimal operational impact. Light fixtures, minor plumbing fixtures, non-critical office equipment. Run to failure, then replace.
The metrics that drive tiering decisions: failure consequence (safety, production, regulatory), downtime cost per hour, spare-parts lead time, and historical MTBF/MTTR profiles. An asset with a 48-hour parts lead time and a $10,000/hour downtime cost belongs in Tier 1 or 2 regardless of how rarely it has failed before.
Statistic: An applied RAM-LCC study found that shifting from corrective to preventive maintenance improved MTBF by approximately 15% and reduced MTTR by approximately 10%, cutting life-cycle cost by roughly 8–10%.
Pro Tip: Build your criticality scoring into a simple matrix: consequence (1–5) × probability of failure (1–5). Any asset scoring above 12 belongs in Tier 1 or 2. Revisit scores annually as failure history accumulates.
OxMaint’s industry comparison notes that many facilities still perform a large share of reactive work, and recommends a hybrid approach: predictive for critical assets, preventive for moderate assets, reactive only where failure consequence is low.
How to design an effective preventive maintenance program
A PM program is only as good as the work orders it generates. The output you are building toward: predictable, CMMS-tracked work orders that feed compliance logs and budget forecasts. Here is how to get there.
Step-by-step program design
- Build your asset register. Document every maintainable asset: asset ID, location, make/model, install date, criticality score, vendor manuals, and warranty terms. No register means no reliable PM schedule.
- Score criticality. Apply the consequence × probability matrix from the tiering section. This determines which assets get PM and at what frequency.
- Define PM tasks and intervals. Pull from manufacturer recommendations, failure history, and industry standards (ASHRAE, NFPA, ANSI). For new assets with no failure history, start with manufacturer intervals and plan to adjust.
- Set a spare-parts policy. Identify critical spare parts for each PM task. Set minimum stock levels based on lead time and failure risk. Stockouts during a planned PM are avoidable and expensive.
- Configure your CMMS. Enter assets, PM schedules, task checklists, and alert thresholds. Assign technicians and set escalation rules for missed PMs. CMMS adoption and basic condition checks are among the highest-impact early steps for raising PM compliance rates.
- Set KPIs and an audit cadence. Define your baseline metrics (MTBF, MTTR, % planned work, PM compliance rate) before launch so you can measure change.
Pre-launch checklist
- Asset data fields complete (ID, location, criticality, install date)
- Baseline failure history pulled from work order records or vendor data
- Vendor manuals and OEM service intervals documented
- Spare part minimum levels set for Tier 1 and 2 assets
- CMMS configured with PM schedules and technician assignments
- KPI baseline recorded
Pro Tip: Avoid over-maintenance by monitoring PM compliance data for the first 3–6 months after launch. If findings are frequent, shorten it.
Sample PM checklist by asset class
PM tasks map to four basic interval bands: weekly, monthly, quarterly, and annual. Daily checks are usually operator-level (visual inspections, fluid levels) and belong in an operator log rather than a formal PM work order.
The frequencies below are starting points. Tune them to your actual failure data and operating conditions within the first 6 months of your program.
| Asset Class | Representative PM Tasks | Suggested Frequency |
|---|---|---|
| HVAC units | Filter replacement, coil cleaning, belt inspection, refrigerant check, drain pan flush | Monthly (filters); Quarterly (coils, belts); Annual (refrigerant, full inspection) |
| Chillers | Tube cleaning, refrigerant leak check, oil analysis, controls calibration | Quarterly; Annual (full overhaul) |
| Boilers | Burner inspection, flue gas analysis, safety valve test, water treatment check | Monthly (water); Quarterly (burner); Annual (full inspection) |
| Pumps | Bearing lubrication, seal inspection, vibration check, alignment verification | Monthly (lubrication); Quarterly (vibration, seals) |
| Generators | Load bank test, oil and filter change, coolant check, battery test, fuel quality check | Monthly (visual, battery); Quarterly (oil, coolant); Annual (load bank) |
| Elevators | Cable inspection, brake test, lubrication, safety device test, door operation check | Monthly; Annual (full code inspection) |
| Roofing and exterior surfaces | Roof membrane inspection, gutter clearing, soft-wash cleaning for moss/algae, sealant inspection, downspout check | Quarterly (gutters, visual); Annual (membrane, soft wash, sealant) |
| Lighting systems | Lamp replacement, fixture cleaning, emergency lighting test, ballast inspection | Quarterly (emergency test); Annual (full audit) |
| Electrical panels | Thermal imaging, connection torque check, breaker test, arc-flash label verification | Annual (thermal imaging, torque); Biennial (full inspection) |
For roofing and exterior surfaces, soft-wash cleaning and moss removal are PM tasks that protect membrane integrity and prevent biological growth from degrading surface materials. Exterior cleaning scheduled as PM extends envelope component life and reduces the frequency of costly repairs. Whitediamondpressurewashing provides scheduled soft-wash and roof-cleaning services for property managers in Citrus County who want these tasks covered under a recurring maintenance scope. A property maintenance checklist can help you map exterior tasks to the right intervals.
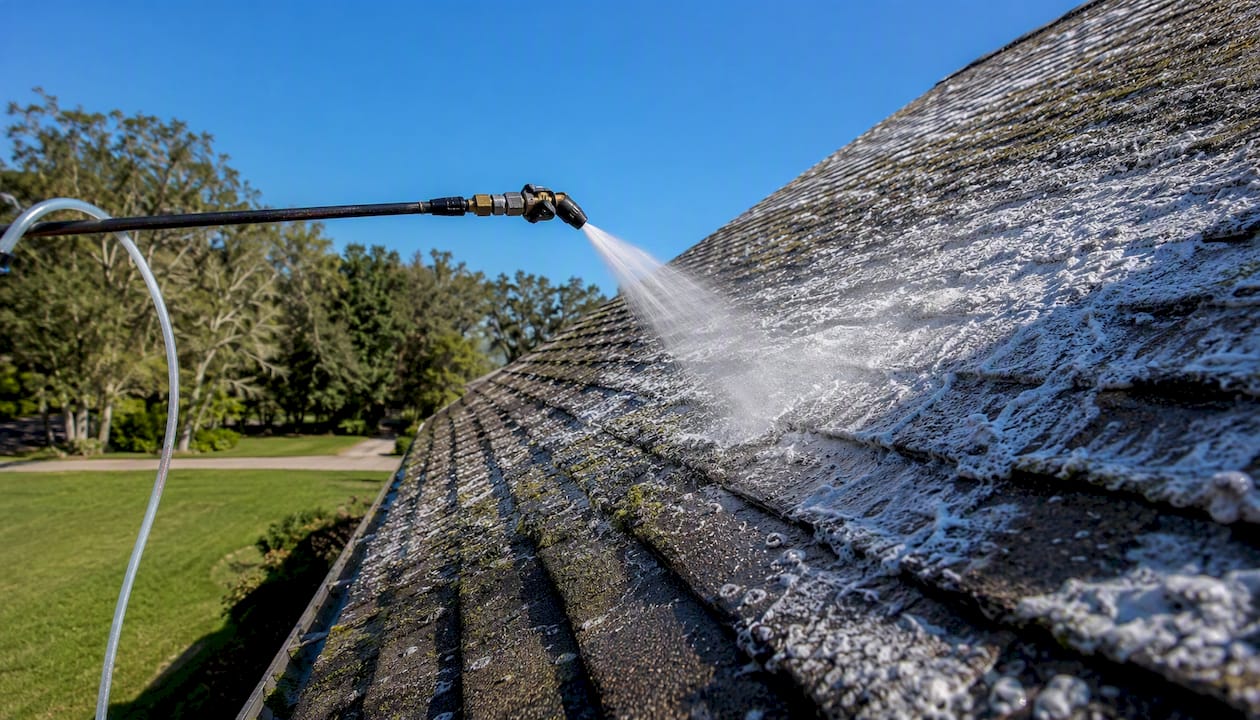
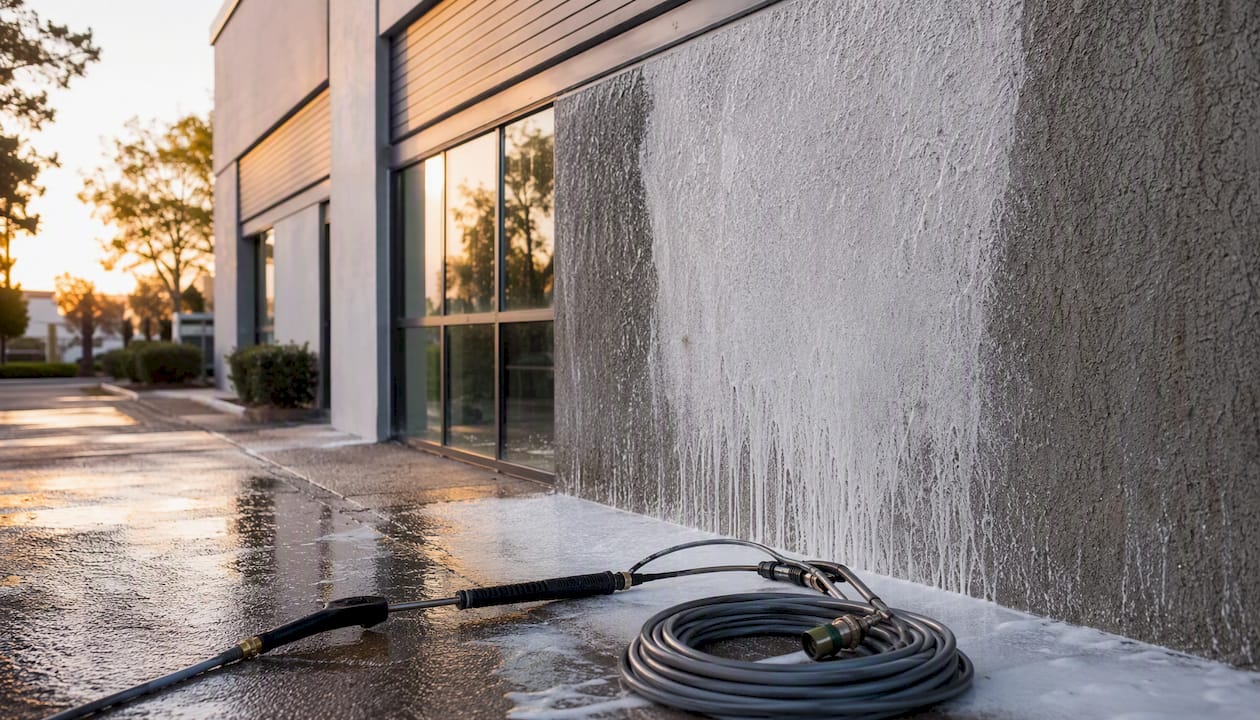
For facade and building envelope assets, practical PM actions include soft washing, moss removal, and gutter clearing. Maintaining building facades through scheduled cleaning materially extends envelope component life and belongs in any multi-family or commercial PM schedule.
Which KPIs tell you if your PM program is working?
Measuring PM performance requires a small set of well-defined metrics tracked at a consistent cadence. The table below covers the core KPIs, how to calculate each, and how often to report.
A simple ROI example
Assume a facility spends $120,000 annually on a PM program covering 80 assets. Before PM, emergency repairs averaged $200,000 per year and unplanned downtime cost an estimated $80,000 in lost productivity. After 12 months of PM, emergency repair spend drops to $90,000 and downtime losses fall to $35,000. Net savings: $155,000. Program cost: $120,000.
That math is conservative. The ETASR study found that shifting from corrective to preventive maintenance reduced life-cycle cost by roughly 8–10%, and further gains are available by adding predictive capabilities on critical assets.
Statistic: Peer-reviewed research using Weibull-based models confirms that properly timed PM increases machine reliability and extends average time between failures, validating the MTBF improvements that drive ROI calculations.
Closing that gap is where the budget savings actually show up.
Common PM tradeoffs and pitfalls to avoid
PM programs fail in predictable ways. Knowing the failure modes in advance saves you from building a program that looks good on paper but collapses in practice.
- Over-maintenance. Performing PM too frequently wastes labor and parts, and can actually introduce failure by disturbing components that were running fine. Manufacturer intervals are a starting point, not a mandate.
- Poor asset data. A PM schedule built on incomplete or inaccurate asset records generates wrong-interval tasks and missed assets. Garbage in, garbage out.
- Low PM compliance. Scheduled tasks that are consistently skipped or deferred are worse than no schedule at all. They create a false sense of coverage while leaving assets unprotected.
- Ignoring failure root causes. PM reduces failure frequency but does not eliminate it. When failures do occur, a root cause analysis (RCA) should follow. Repeating the same PM without addressing the underlying cause is expensive.
- Missing spare parts. A PM task that cannot be completed because a part is out of stock becomes an unplanned outage. Spare-parts policy is not optional.
- Treating PM as paperwork. Checking boxes without actually performing the task is a compliance liability and an operational risk. PM records are evidence in regulatory audits and insurance claims.
The cost of planned downtime is real but predictable. The cost of unplanned outages is unpredictable and almost always higher. Blindly applying manufacturer intervals without checking against actual failure history is a common source of both over-maintenance and missed failures.
Pro Tip: Use a 90–180 day tune-up window after your PM rollout to adjust task frequencies with real data. Track findings per PM task: if a task consistently shows no issues, extend the interval. If it consistently catches problems, shorten it.
A concise PM rollout plan from pilot to full scale
Rolling out PM across an entire facility at once is a reliable way to overwhelm your team and produce poor compliance data. A phased approach works better.
Rollout steps
- Select your pilot assets (month 0–1). Choose 8–20 assets across one or two systems. Pick a mix of criticality levels so you can test scheduling, compliance tracking, and parts logistics before scaling.
- Record baseline metrics (month 0–1). Pull 12 months of historical work order data for pilot assets. Document MTBF, MTTR, emergency repair frequency, and current % planned work.
- Configure PM schedules in your CMMS (month 1). Enter tasks, intervals, technician assignments, and parts requirements. Run a test cycle before going live.
- Execute the pilot and collect data (months 1–4). Run PM as scheduled. Track compliance rate, findings per task, and any failures that occur despite PM.
- Tune intervals (months 3–4). Use the 90-day data to adjust task frequencies. Drop tasks with zero findings; increase frequency on tasks catching active degradation.
- Set scale triggers (month 4). Define the criteria for expanding: PM compliance rate above 85%, MTBF trending up, emergency repair share trending down.
- Scale to remaining asset tiers (months 4–8). Expand by system or building zone. Replicate the CMMS configuration and parts policy from the pilot.
- Continuous improvement (ongoing). Review KPIs quarterly. Run RCA on any failures that occur. Adjust intervals annually based on accumulated failure data.
Milestone timeline
- Months 0–1: Asset register complete, pilot assets selected, CMMS configured, baseline metrics recorded.
- Months 1–4: Pilot running, compliance tracked weekly, tune-up adjustments made at month 3.
- Months 4–8: Scale to full asset population, vendor contracts updated for expanded scope.
- Month 8 onward: Quarterly KPI reviews, annual interval audits, continuous improvement cycle active.
Change management notes
- Train technicians on CMMS work-order entry before launch. Compliance data is only useful if it is accurate.
- Assign a PM champion (a supervisor or lead tech) who owns the compliance rate metric.
- For vendor-covered PM tasks (elevator inspections, exterior cleaning, electrical thermography), update contracts to align with your PM schedule and require digital documentation. Property management cleaning contracts that specify frequency and scope make vendor PM tasks as trackable as internal ones.
What tools and technologies support a PM program?
The right technology level depends on where your program is today. Buying a full IoT sensor network before you have a working asset register is a common and expensive mistake.
The maturity ladder
Stage 1: Spreadsheets. Adequate for fewer than 50 assets with simple schedules. Breaks down fast as asset count grows and compliance tracking becomes manual.
Stage 2: CMMS with manual PMs. The right entry point for most facilities. Platforms like IBM Maximo, Fiix, UpKeep, and Maintenance Connection automate work-order generation, track compliance, and store asset history. This is where most facilities should start.
Stage 3: CMMS plus selective IoT. Add basic condition monitors (vibration sensors, temperature loggers, pressure transducers) on Tier 1 and 2 assets. Feed readings into the CMMS to trigger condition-based PM tasks. Cost-effective when targeted at assets with high failure consequence.
Stage 4: Full predictive analytics on critical assets. Continuous monitoring with machine-learning failure prediction. Justified for assets where unplanned failure costs exceed the sensor and analytics investment by a clear margin.
Core tool categories
- CMMS/EAM platforms: Work-order automation, PM scheduling, asset history, compliance reporting. Non-negotiable for any program above 50 assets.
- Mobile work-order apps: Allow technicians to receive, complete, and close work orders in the field without paper. Reduces data-entry lag and improves compliance accuracy.
- Basic condition monitors: Vibration pens, infrared thermometers, and data loggers cost a fraction of full PdM systems and catch the majority of mechanical degradation on rotating equipment.
- Inventory and spare-parts modules: Integrated with the CMMS, these track parts consumption against PM tasks and trigger reorder points automatically.
- Dashboards and reporting: KPI dashboards that surface MTBF, compliance rate, and emergency repair share in real time give supervisors the visibility to act before a metric deteriorates.
Selection criteria worth prioritizing: interoperability with existing building management systems, ease of adoption for field technicians, ability to automate PM scheduling without manual triggers, vendor support quality, and total cost of ownership over three years. A system your technicians will not use is worth nothing regardless of its feature list.
For homeowners and smaller property managers evaluating PM tools and practices, this preventive maintenance guide covers practical starting points at the property level.
Why PM is really about control, not just cost savings
Most PM articles lead with cost savings. That framing is correct but incomplete. The deeper value of a PM program is that it moves a maintenance department from reactive to deliberate. When you are firefighting, your schedule belongs to your equipment. When you are running PM, you own the schedule.
Two practical lessons stand out from working through PM program design. First, start smaller than feels comfortable. A pilot on 10–15 assets teaches you more about your CMMS configuration, your parts logistics, and your technicians’ capacity than any planning exercise. Second, measure everything from day one. A baseline MTBF and emergency repair rate recorded before launch is the only way to prove the program’s value to finance and leadership 12 months later.
Whitediamondpressurewashing applies this same logic to exterior asset care in Citrus County. Scheduled soft washing and roof cleaning are not cosmetic services. They are PM tasks that protect membrane integrity, prevent biological growth from degrading surface materials, and extend the service life of roofing and facade components. Treating them as optional is the same mistake as skipping a quarterly pump inspection because the pump is still running.
Exterior PM for your building envelope: schedule a service

If your PM program covers HVAC, electrical, and mechanical systems but leaves roofing and exterior surfaces on a reactive schedule, you are carrying avoidable risk. Biological growth, moss, and surface contamination degrade roofing membranes, siding, and concrete faster than most facility managers expect.
Whitediamondpressurewashing provides scheduled soft washing and exterior cleaning services for residential and commercial properties in Citrus County and surrounding areas. Roof cleaning, house washing, driveway and walkway cleaning, and concrete sealing are available as recurring PM-aligned service agreements. Get a free estimate and add exterior asset care to your PM schedule before the next inspection cycle.
Sources
The sources below back the claims in this article and are worth bookmarking for procurement discussions and executive presentations.
- Economics of Manufacturing Machinery Maintenance: A Survey and Analysis of U.S. Costs and Benefits (NIST)
- Optimal Periods of Conducting Preventive Maintenance to Reduce Expected Downtime (PMC article)
- Maintenance strategy selection impact on Life Cycle Cost (ETASR DOI)
- The ROI of preventive maintenance (IFMA FMJ)
- What is preventive maintenance? (Facilio)
Recommended
- Why Home Maintenance Matters: Save Money, Protect Property – white-diamond-pressure
- How to Maintain Building Facades: A Property Manager’s Guide – white-diamond-pressure
- Role of Pressure Washing in Preventive Maintenance – white-diamond-pressure
- Property Maintenance Checklist: Homeowner’s 2026 Guide – white-diamond-pressure